“What is a good way to estimate the number of test cases?”
First things first. I’m not a big fan of test case based approach, neither I’ve seen testing estimates that weren’t at best guesstimates. But people ask questions, and this is their starting point.
Enough been said about smart-ass approach.
Instead of critiquing those willing to learn let’s help them understand and let’s help them to develop their own understanding.
Cross-posting my answer from Quora.
Preface
So a question was asked: Testing Strategy: What is a good way to estimate the number of test cases? and details were requested: “I am looking for a statistical answer based on probability of false positive and negative. The technique I have seen in the field, “as many cases as the budget allows”, seems pretty sloppy.”
What can I say? A great question! People do need to plan. Their approach depends on their understanding of the problem.
In my answer I address both the simplistic understanding and suggest ideas proven in the industry.
Part 1 - Let’s take a ridiculously simple model
- let’s just pretend that each “code square” is completely isolated;
- let’s just pretend that each feature is completely isolated;
- let’s just pretend that there could be only one error per code module resulting in one bug in the feature;
- let’s just pretend that one test per feature provides a “full coverage” and guarantees finding that one bug;
- let’s just pretend that the time to perform each test is roughly the same.
- so that in our discrete flat model there could be only 100 tests covering the total of 100 features / code modules.
Part 2 - Let’s have fun modeling
The question was about probability and statistics, so..
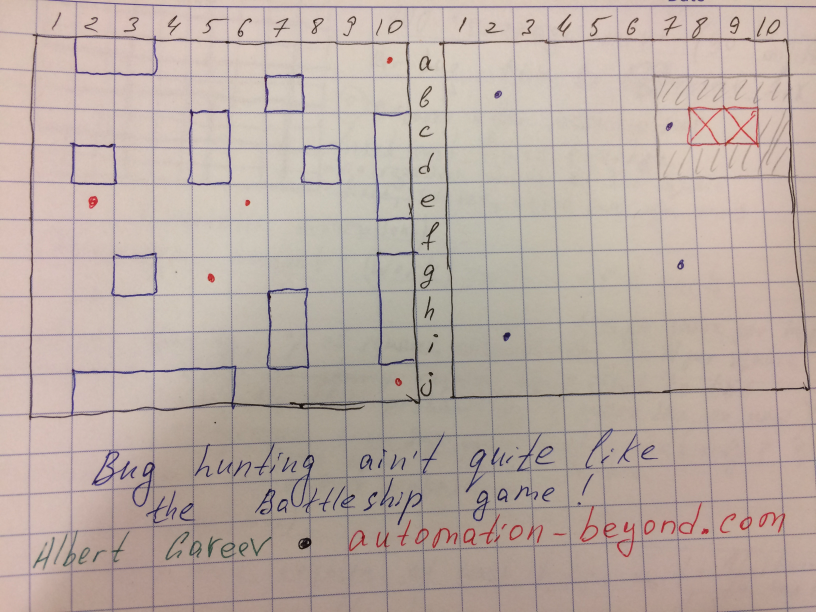
Let’s consider that there are 20 bugs, and they come in some patterns (like ship positioning rules and patterns in the game).
How many tests one needs to discover all 20 bugs if there are 100 of squares to cover?
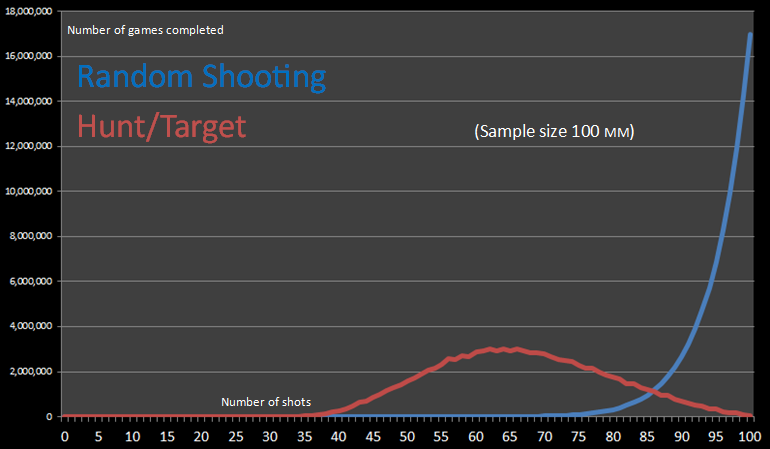
On the image above: statistical distribution of completed games (all ships hit) vs. number of shots. Source: Battleship game analysis.
- Blue curve represents results of random shooting.
- Notice that the answer for how many is something like “at least 70, most likely 95 or even more”.
- Red curve represents results of a more strategic approach, using knowledge of patterns and learning from the results on the go.
- Notice that the answer for how many is something like “at least 35, most likely 65, sometimes more”.
The article suggests further increases in efficiency -
- learning about the style of your opponents
- so that you can develop custom patterns for positioning of your ships to increase chances of avoiding your opponent’s firing patterns;
- so that you can develop custom patterns for targeting of your own shots to increase chances of hitting your opponent’s ships.
- Keeping journal and analyzing your notes
- so that you can learn both from the immediate information and on the hindsight;
- so that you can see the big picture and notice patterns.
Part 3 - Let’s define our testing strategy
There are deterministic and probabilistic aspects in our strategy.
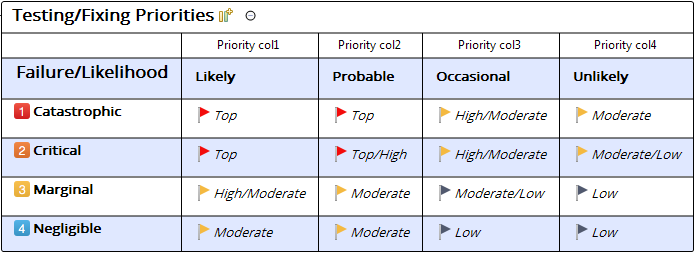
We begin with two cornerstone factors: failure outcome and failure likelihood. I put them together in a matrix, see the image above.
- Learn about your product.
- Classify product areas and elements.
- Identify consequences of failure (outage) of a given product element.
- Assign importance levels (for example, from catastrophic to negligible).
- (Note: you can do this exercise rather informally or follow Integrity Level Schema as defined in IEEE-829 Standard for Software Testing).
- (Note: Pradeep Soundararajan gives a great illustration of failure consequences answering this question with an analogy. Check it out)
- Define priority matrix.
- See the picture above: testing (and, of course, fixing!) importance depends on the consequences of failure and likelihood of it.
- Assign these testing priorities across the product areas.
- You will end up with another table, or a list, or a mind map - depending how you chose to represent your product areas. And now they’re marked based on the priorities.
Voila! Here’s the starting point of your strategy. This is not just an artifact!
It’s a “live” entity:
- as the project unfolds, you’ll be getting more accurate and detailed in defining product areas and classes of failures.
- as for the probabilities (likelihood) - it’s an ever changing picture, so you gonna need a “radar”…
Part 4 - Testing tactics: what’s on your radar?

Image source: Pixabay
To estimate likelihood of failures you might want to use statistical and probabilistic factors. Below I’m suggesting a few common patterns but by all means it’s not an exhaustive list.
- New code. The chances are even higher if no such error detection and prevention has been done like code reviews and unit testing.
- Buggy code. It’s known to have errors. Whatever the reason of this chronic pain, you better keep an eye on it!
- Complex code. If it’s hard to understand and explain, it’s also hard to get right.
- Changed code. If the code was modified in some sense it’s like new. It doesn’t matter if only a few lines were changed, and here’s why - The Universal Pattern of Huge Software Losses by Gerald Weinberg.
- Integration points. Code and/or data that are in some way distributed but must work as a whole.
- Threads. Any sequence is sensitive to load/spike/stress conditions, and there are multi-threading complications.
You are not on your own! Talking to your team mates can help identifying risks and probabilities of bugs. Example: a few questions to ask upon a bug fix -
- Does the fix apply to the all affected functionalities?
- If not, which ones were fixed and which ones were not?
- Are there similar code modules?
- If yes, is it possible they may have same problem?
Conclusion
- Good testing for sure takes probabilities and statistics into account. However, statistics does not equate for [accurate and reliable] prediction.
- Focusing only on pre-calculated number of test cases is very risky because such strategy ignores changing risks and priorities as the projects unfolds.
- However, such “static” assessment of testing coverage and priorities is a good starting point.
- As long as code changes continue new risks arise.
- Moving in small, well-tested increments helps to reduce the risks.
- Spreading testing activities all the way across - from feature walkthrough to code review, from unit testing to production monitoring - helps to reduce the risks.
- Great testing needs 3 components
- strategic vision of the whole team;
- tactical steering by technical leads;
- individual performance of skilled testers.
