Draw Attention With Visual Test Reports
Leave a comment if you first looked at the pictures before reading this text!
As I was putting together notes in my book review I made an entry regarding Attention Filter.
Recap:
- Attention Filter mechanics
- Change detector
- Subconscious.
- Always “on”
- Registers changes in the flow of information
- Importance ranking
- Subconscious.
- Very personal for everyone
- Based on emotional importance
- Change detector
Today I want to cross-reference two examples of visualizing information in testing.
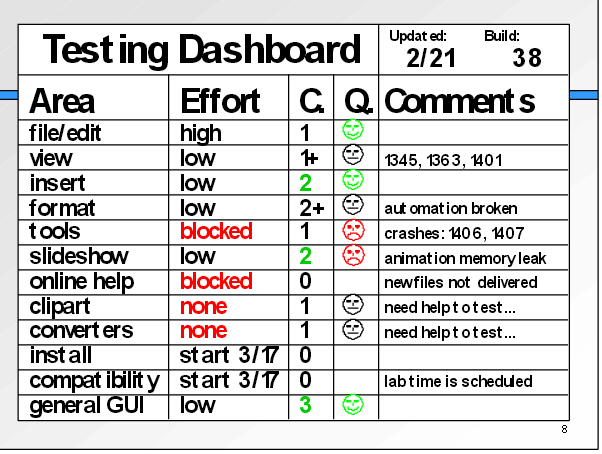
Low Tech Testing Dashboard
A Low Tech Testing Dashboard is an approach introduced by James Bach. It appeals with simple, clear, visual communication on testing progress and product quality. It satisfies well the Attention Filter criteria - red / green colors, easy to register changes, easily recognizable product areas.
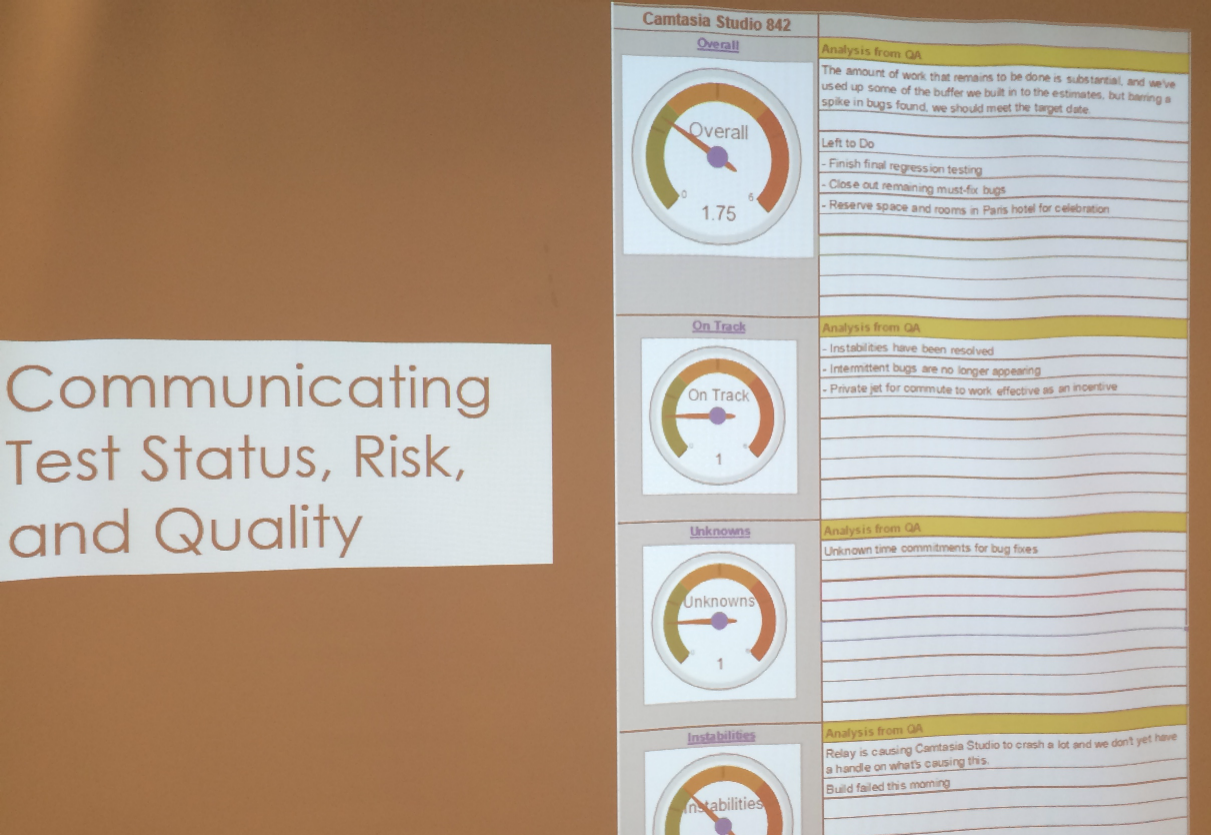
Gauges Chart
The example below was presented at KWSQA 2015 Targeting Quality Conference.
Jess Lancaster gave a remarkable talk named “Show It!: Better Testing through Visual Communication”. The idea of the “gauges” is to simplify and visualize test reports using add-ons that do the task automatically. More details in textual and numeric format are still available for those willing to “zoom in” while gauges give an overview at a glance.